AquaTrack — Helping African Small & Medium Fish Farmers Run Profitable Farms with AI
Role
Lead Product Designer
Timeline
3 Months
Industry
AgriTech / SaaS Product
Tools Used
Design: Figma
Development: Lovable (AI-assisted no-code platform)
Research: Google Forms, WhatsApp, Maze
Collaboration: Slack, Notion
Project Overview
AquaTrack is an AI-powered farm management platform helping African small and medium-scale fish farmers monitor ponds, track expenses, manage growth cycles, and get real-time recommendations, all in one simple dashboard.
As Lead Product Designer, I shaped the entire product experience, from user research and interface design to building and shipping a working MVP using no-code tools. I worked directly with farmers to validate features and iterate based on real-world usage.
The Problem
African fish farmers operate in chaos: scattered notes, no real-time tracking, and zero data insights. This lack of structure leads to high costs and uncertain profits.
"I know my fishes are growing, but I can't tell if I'm making profit or loss."
— Fish farmer, Lagos
My Role
Key Challenges
Challenge 01: Low tech literacy
Most farmers had never used a dashboard. Complex interfaces would fail.
Solution
Designed a mobile-first interface with large touch targets and visual icons.
Challenge 02: Intermittent internet
Farmers operate in rural areas with unstable connectivity.
Solution
Built offline-first features with data sync when online.
Challenge 03: Proving value quickly
Farmers wouldn't pay unless they saw immediate benefit.
Solution
Made the free tier generous and added AI recommendations that save money.
Solution Overview
Designed the system as a structured, cloud-based AI management platform controlled by a management system enabling the connected, market-driven farms.
Design & Development Process
1. Research & Strategy
2 weeks
- •Conducted interviews with 30+ farmers
- •Analyzed competitive landscape
- •Mapped user workflows and pain points
2. Design & Prototyping
3 weeks
- •Created low-fidelity wireframes
- •Built interactive prototypes
- •Validated designs with users
3. Development & Shipping
3 weeks
- •Built MVP using Lovable
- •Integrated backend services
- •Launched beta to first farmers
4. Iteration & Optimizing
1 week
- •Gathered user feedback
- •Fixed critical issues
- •Optimized performance
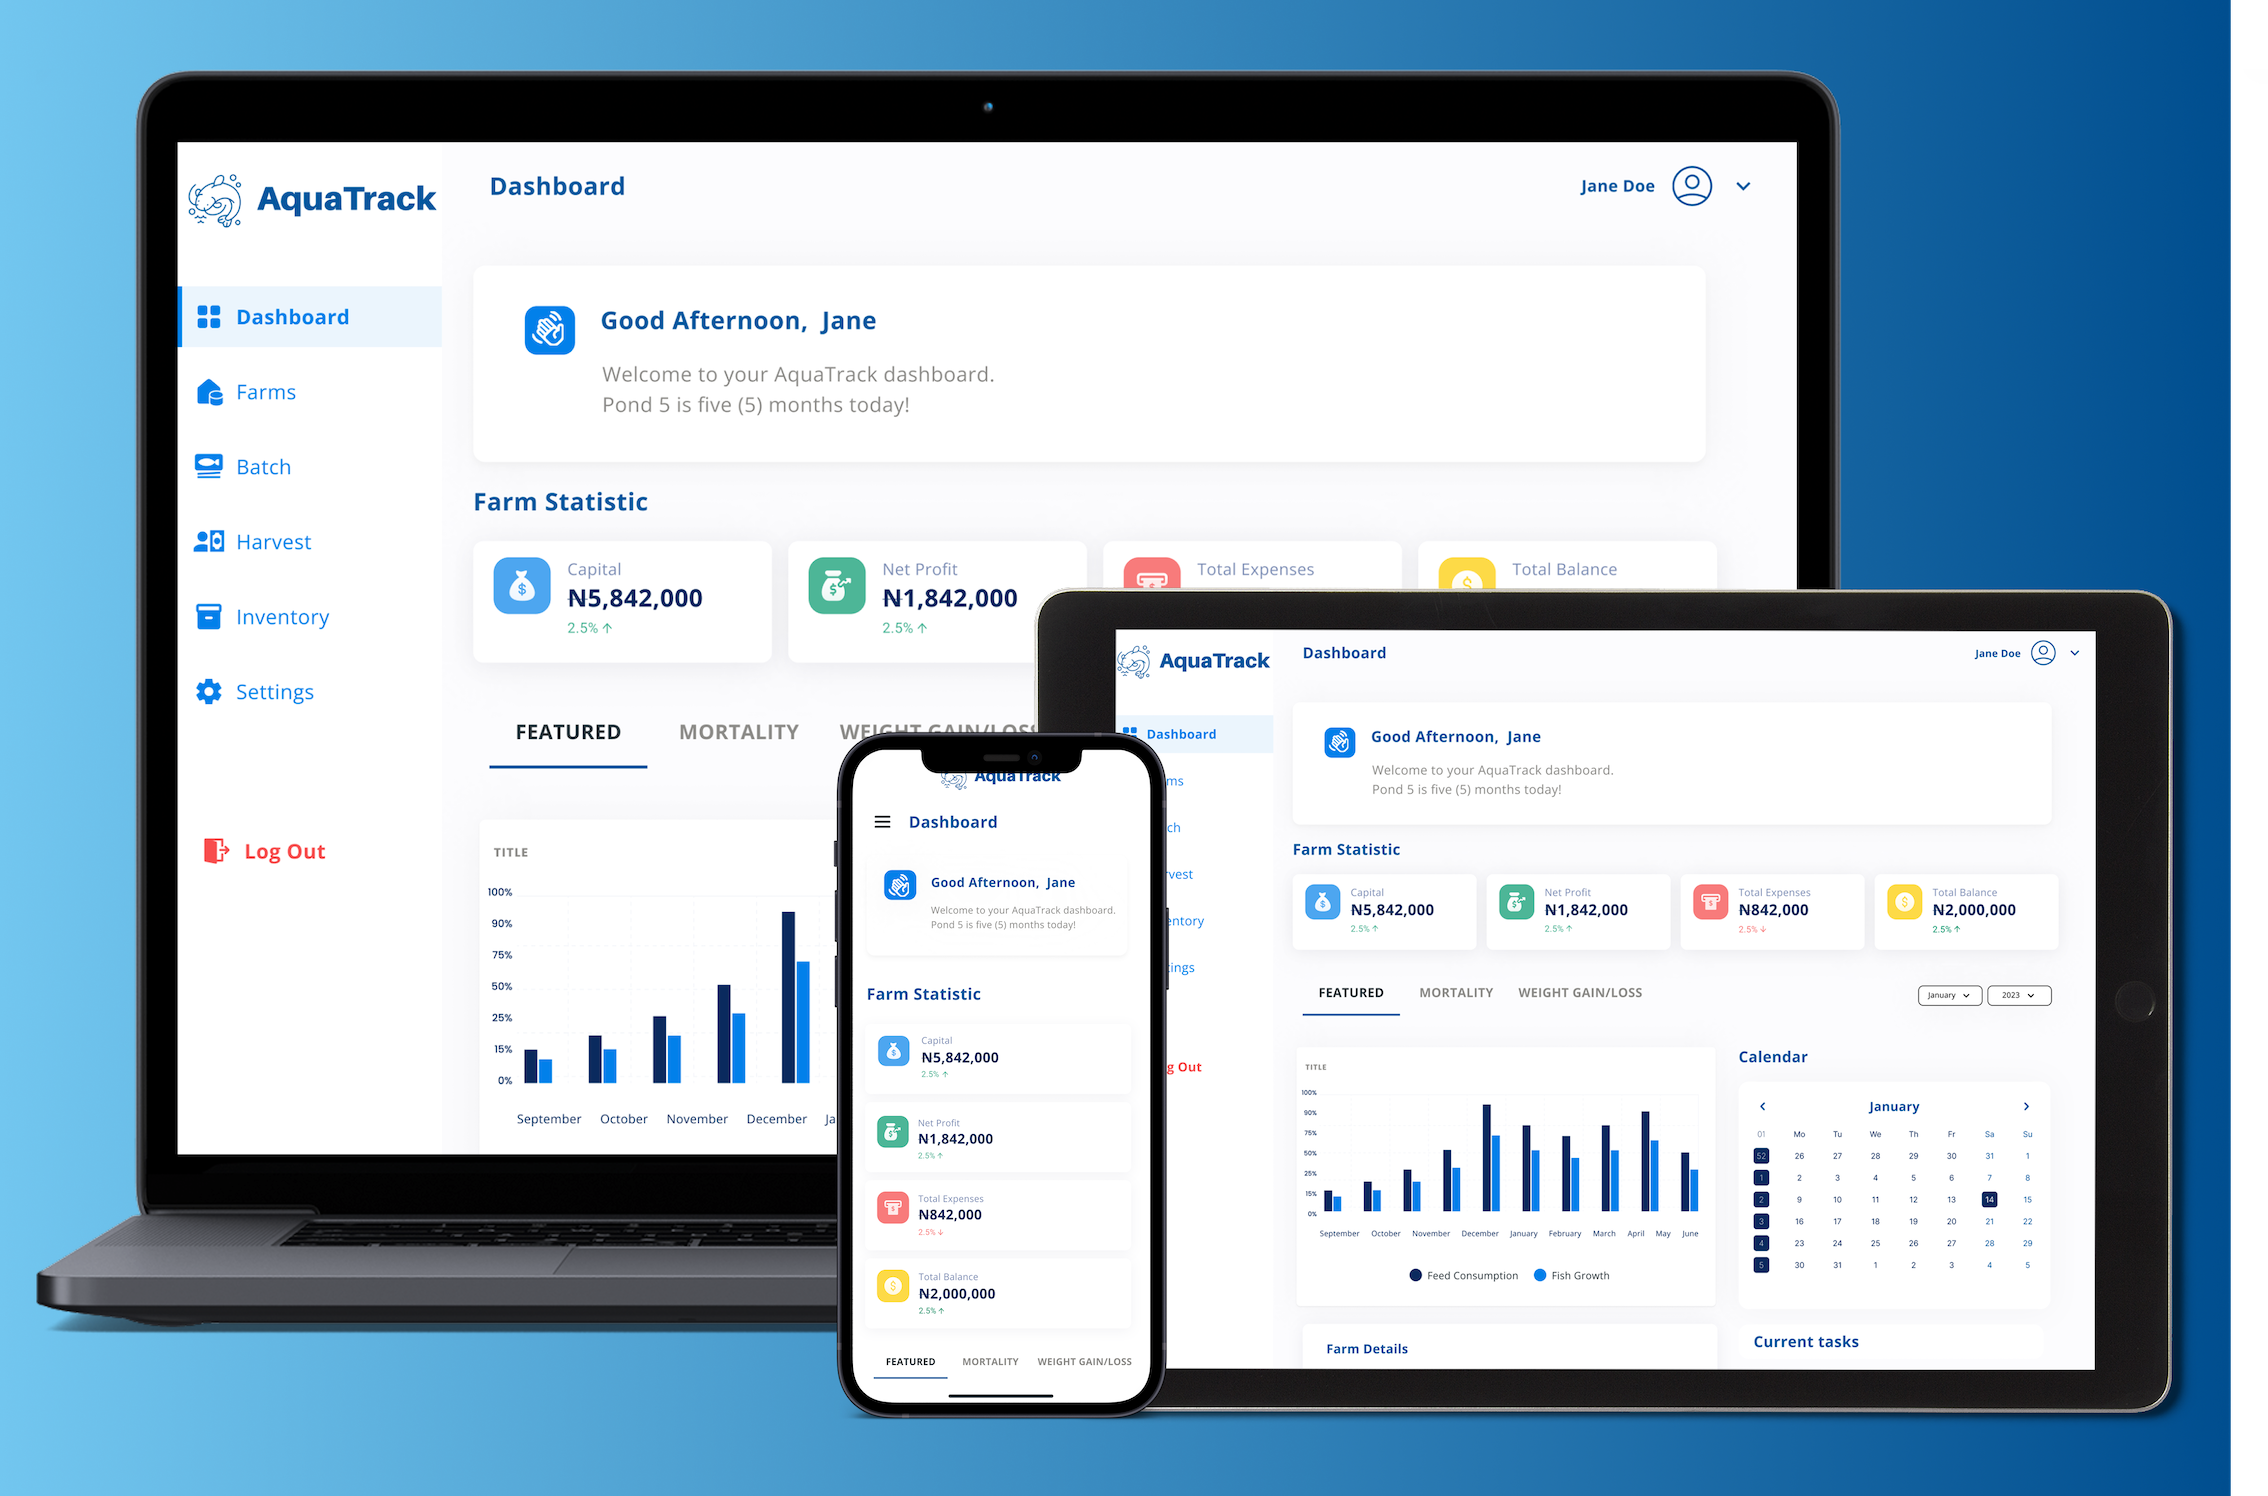
Key Screens
The platform includes dashboards for farm management, batch tracking, harvest planning, pond monitoring, inventory management and financial reporting. Each screen was designed for simplicity and fast data entry, critical for farmers walking in the field.
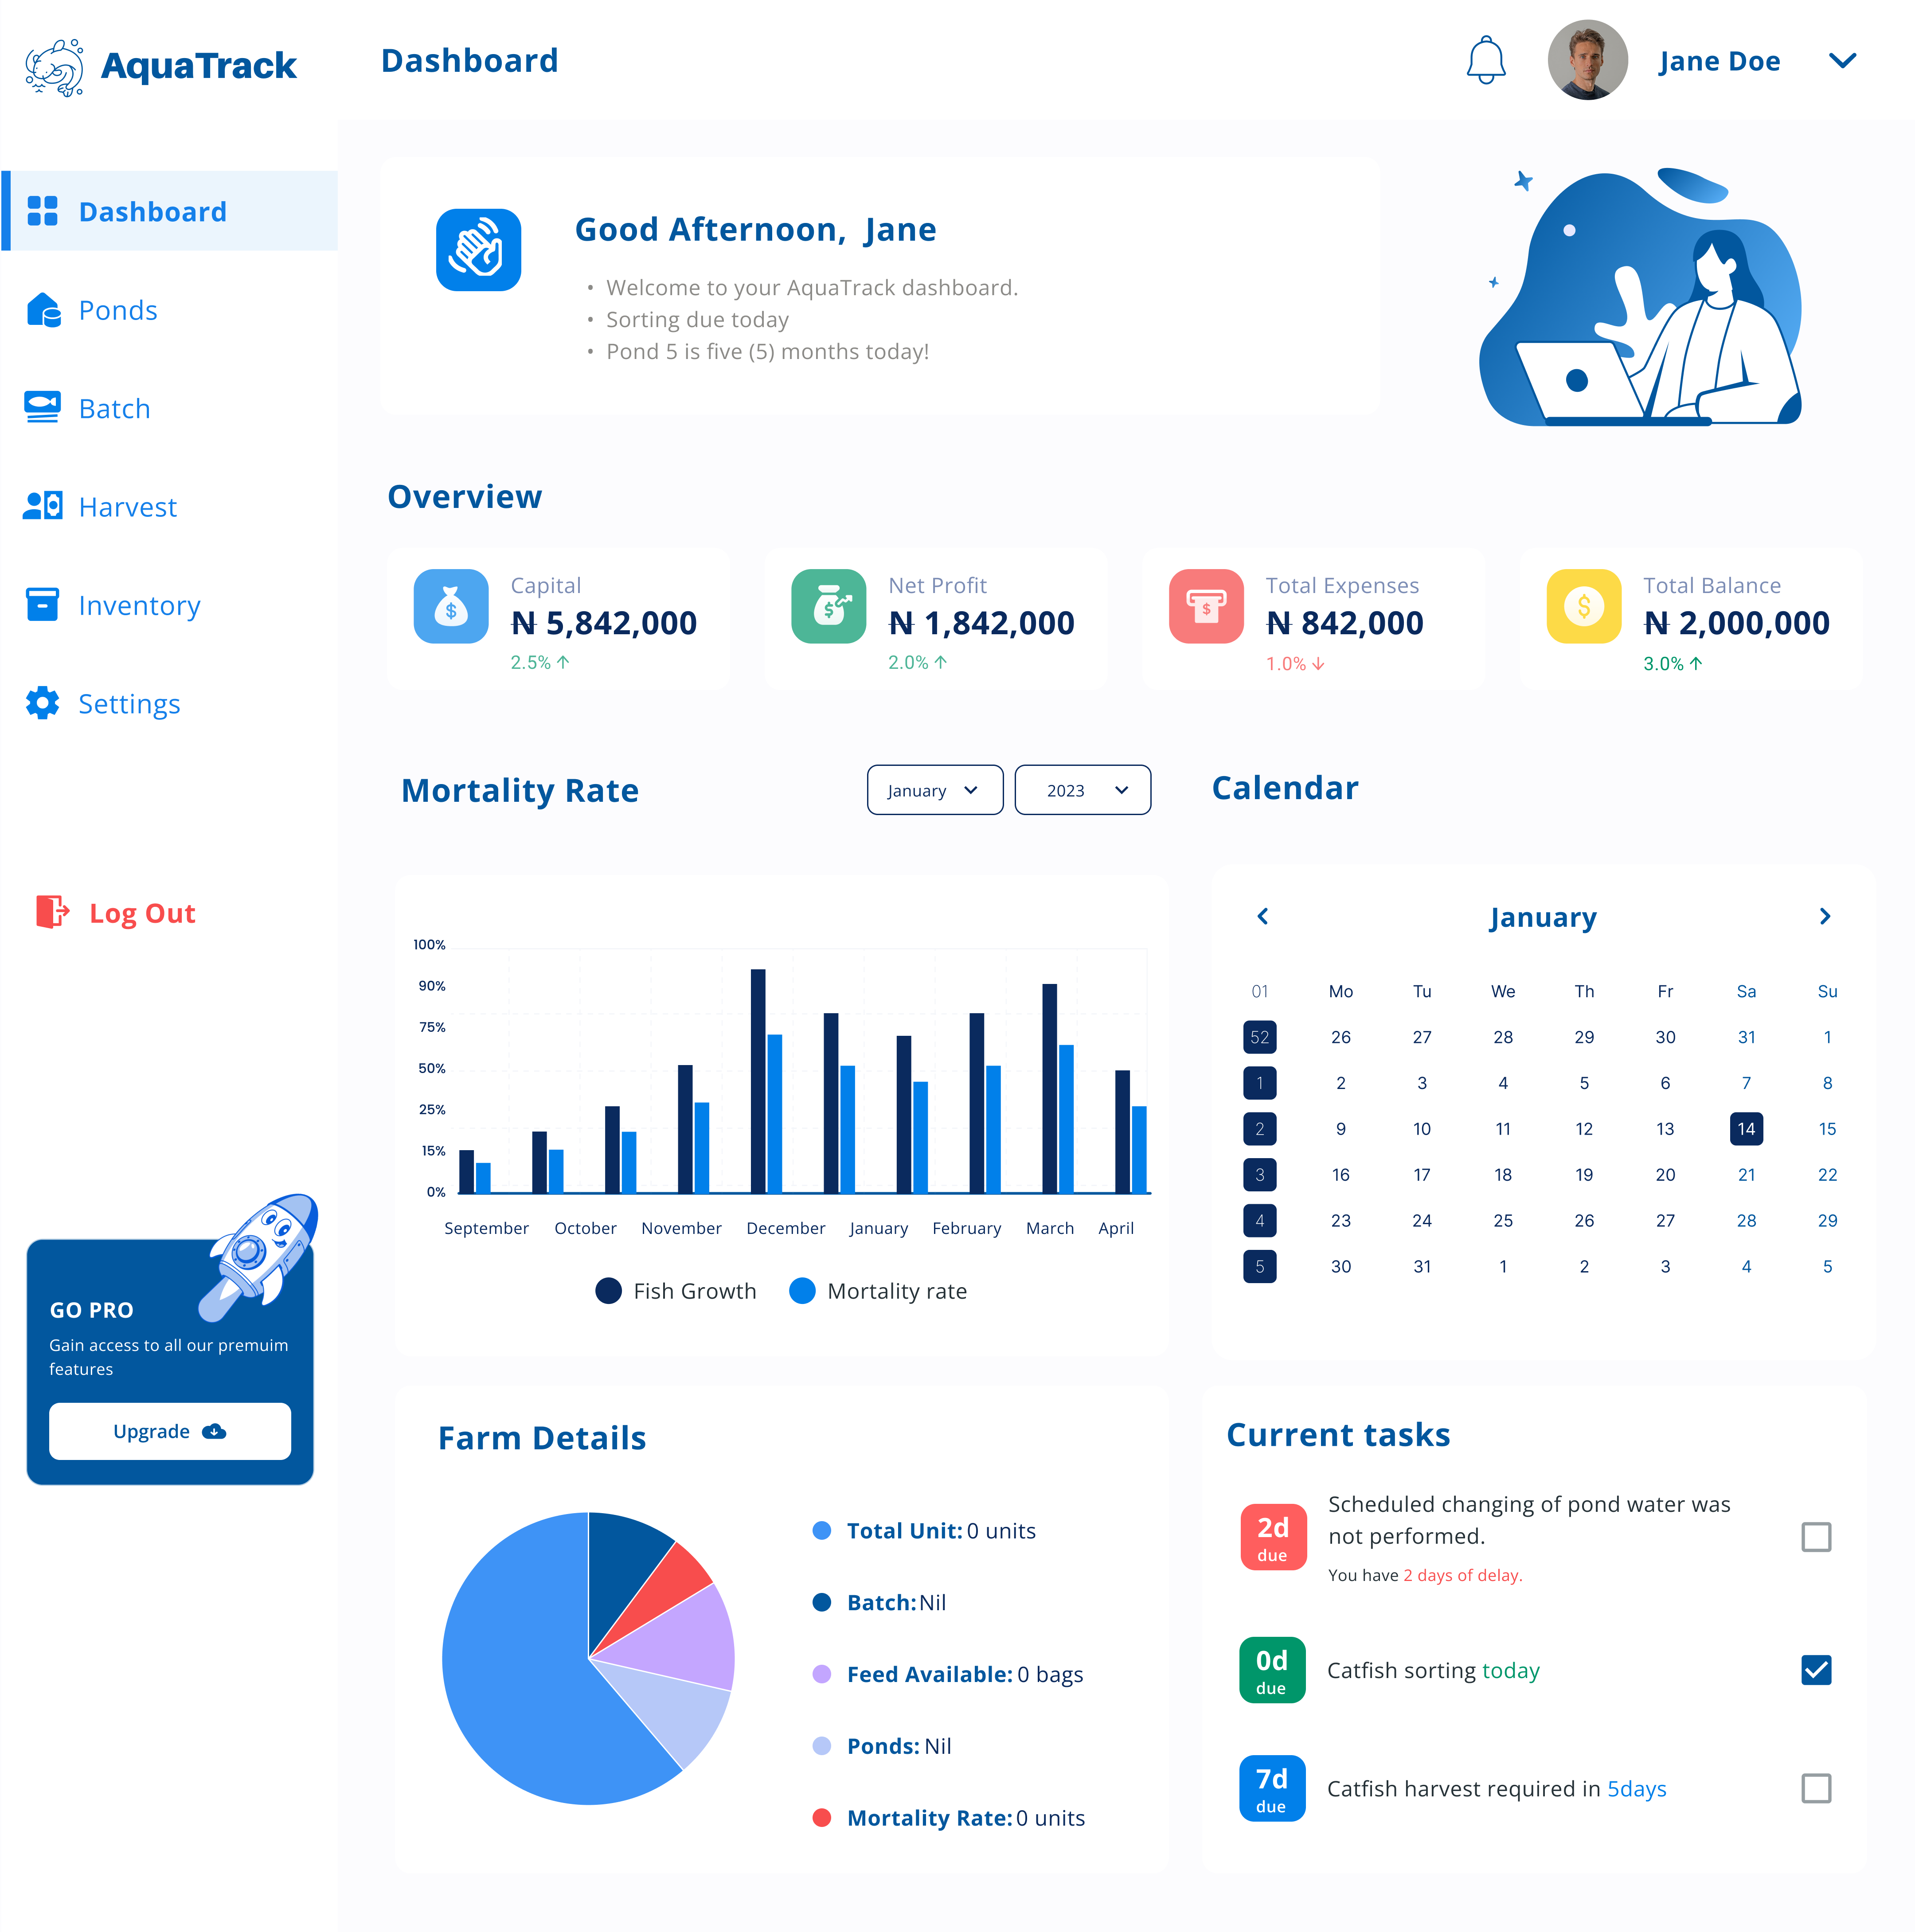
Aquatrack Dashboard
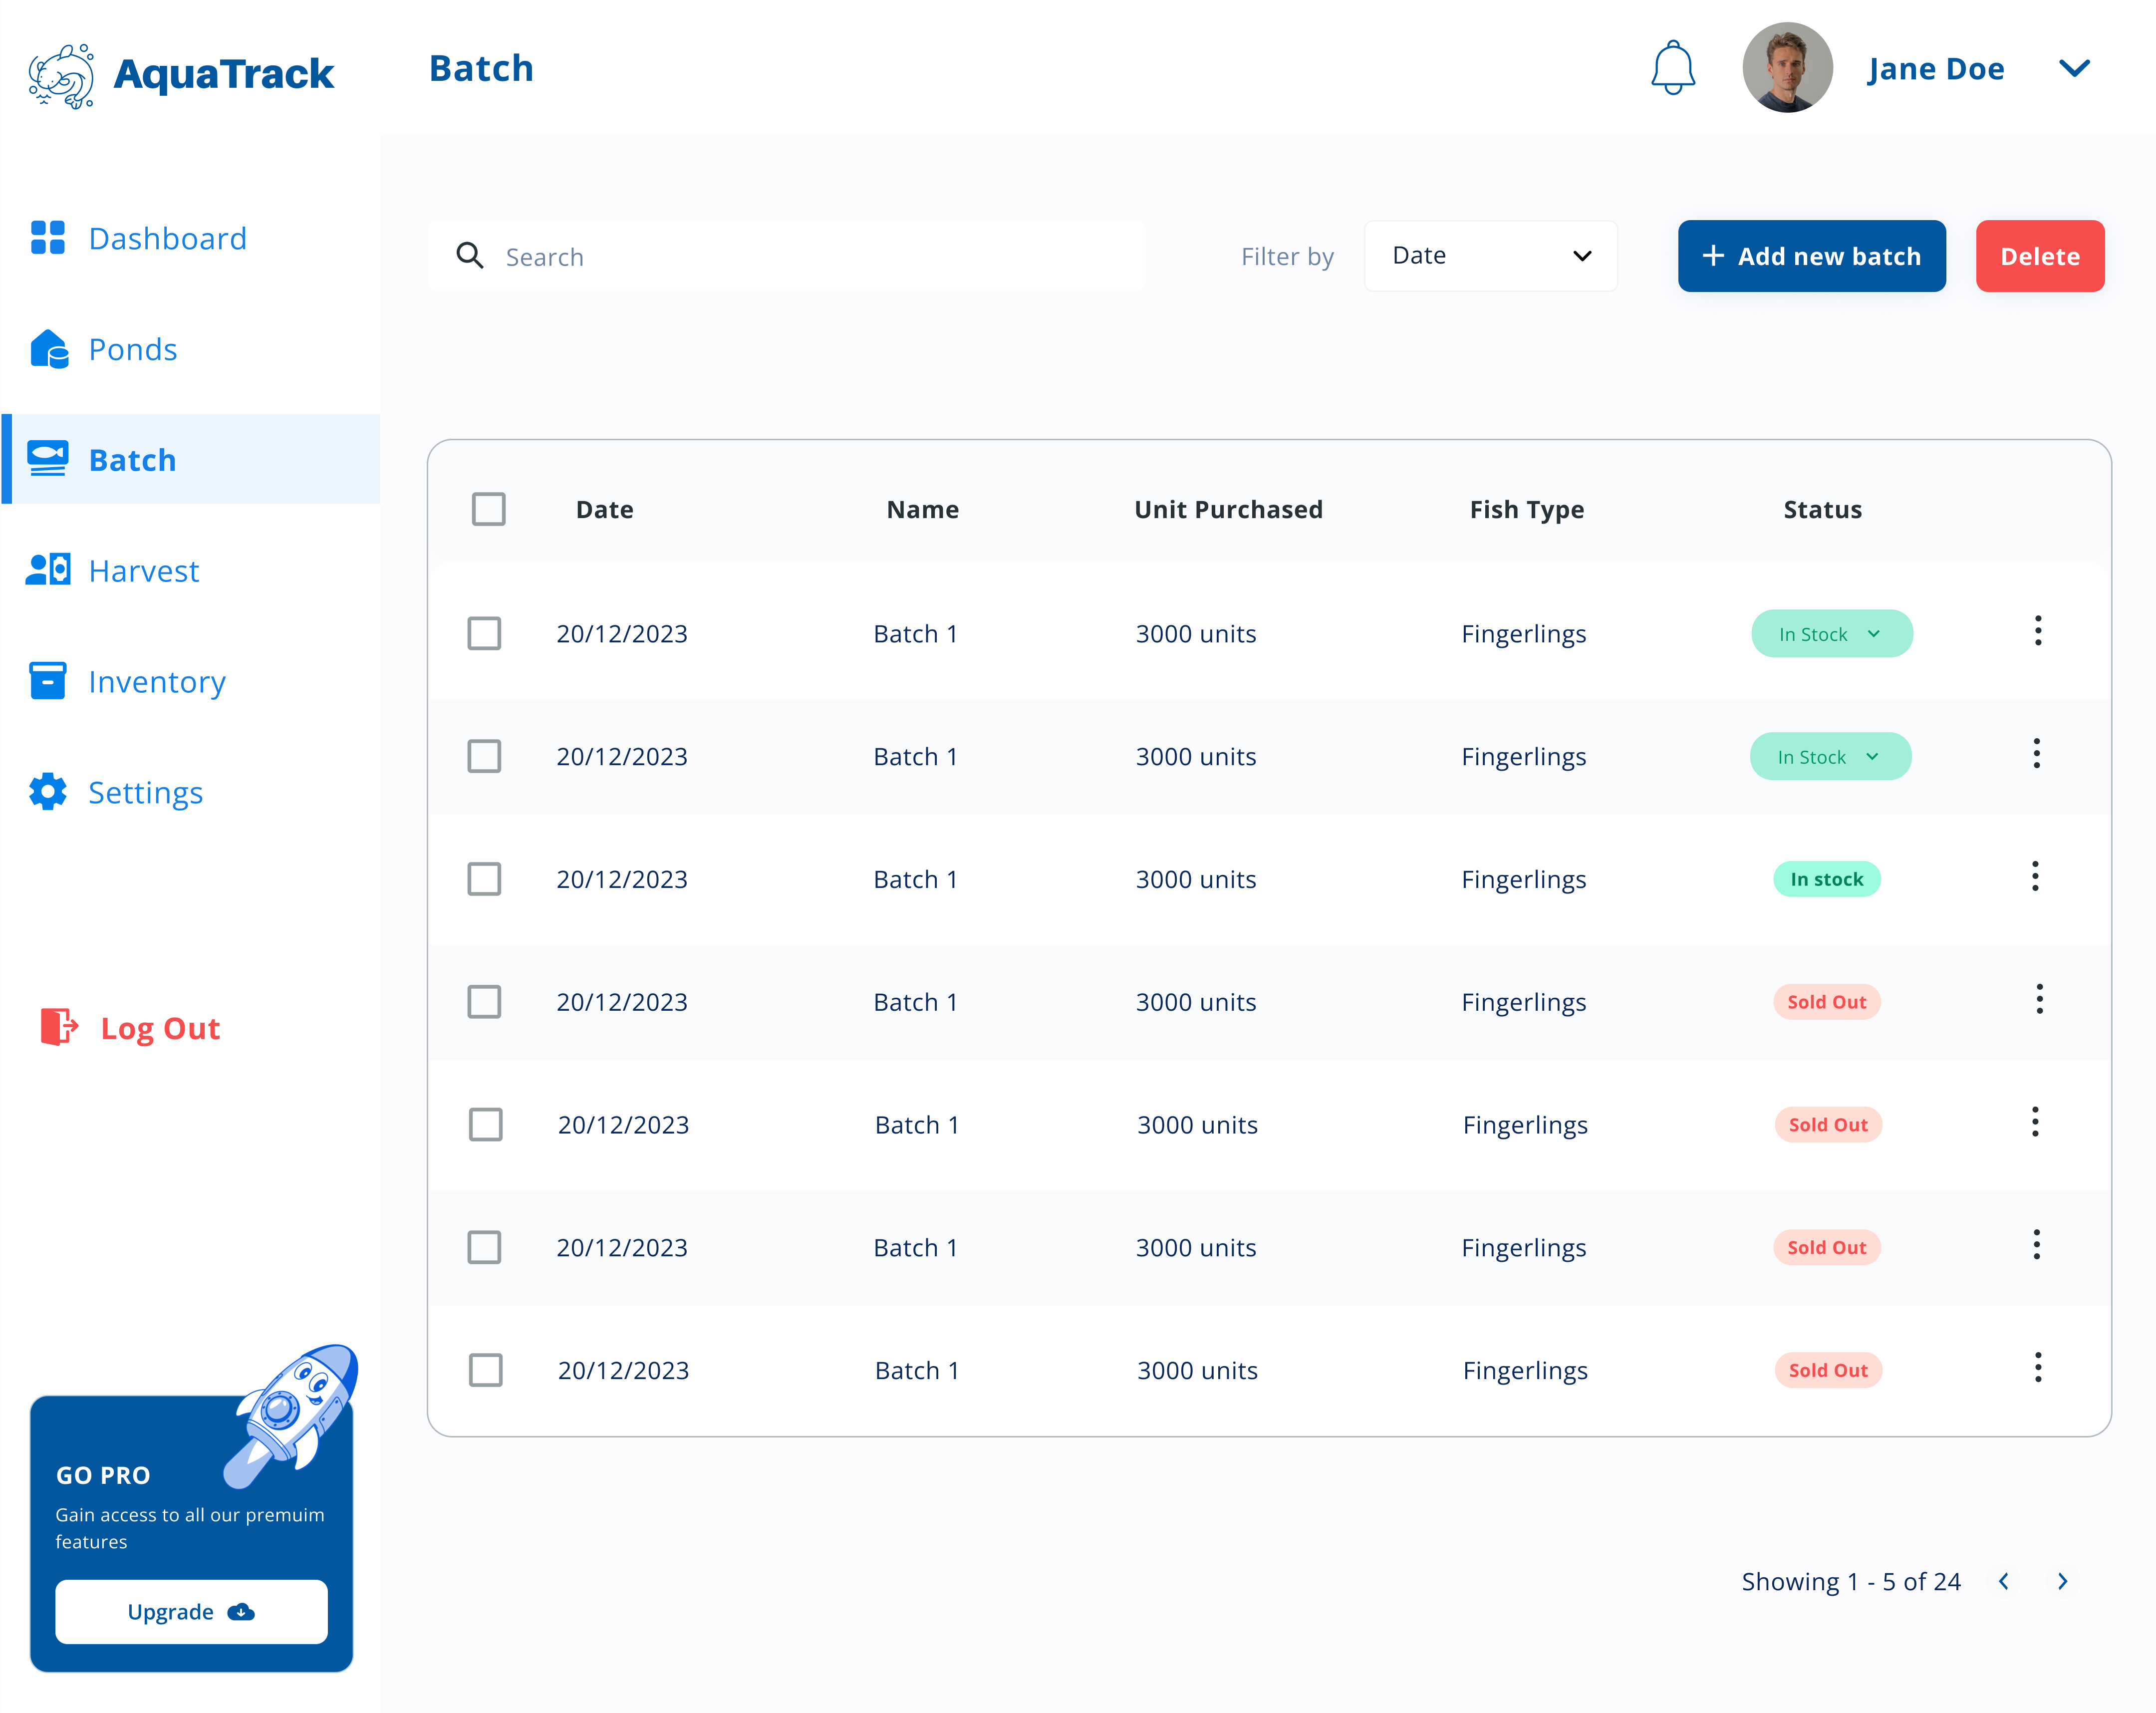
Aquatrack Batch Active
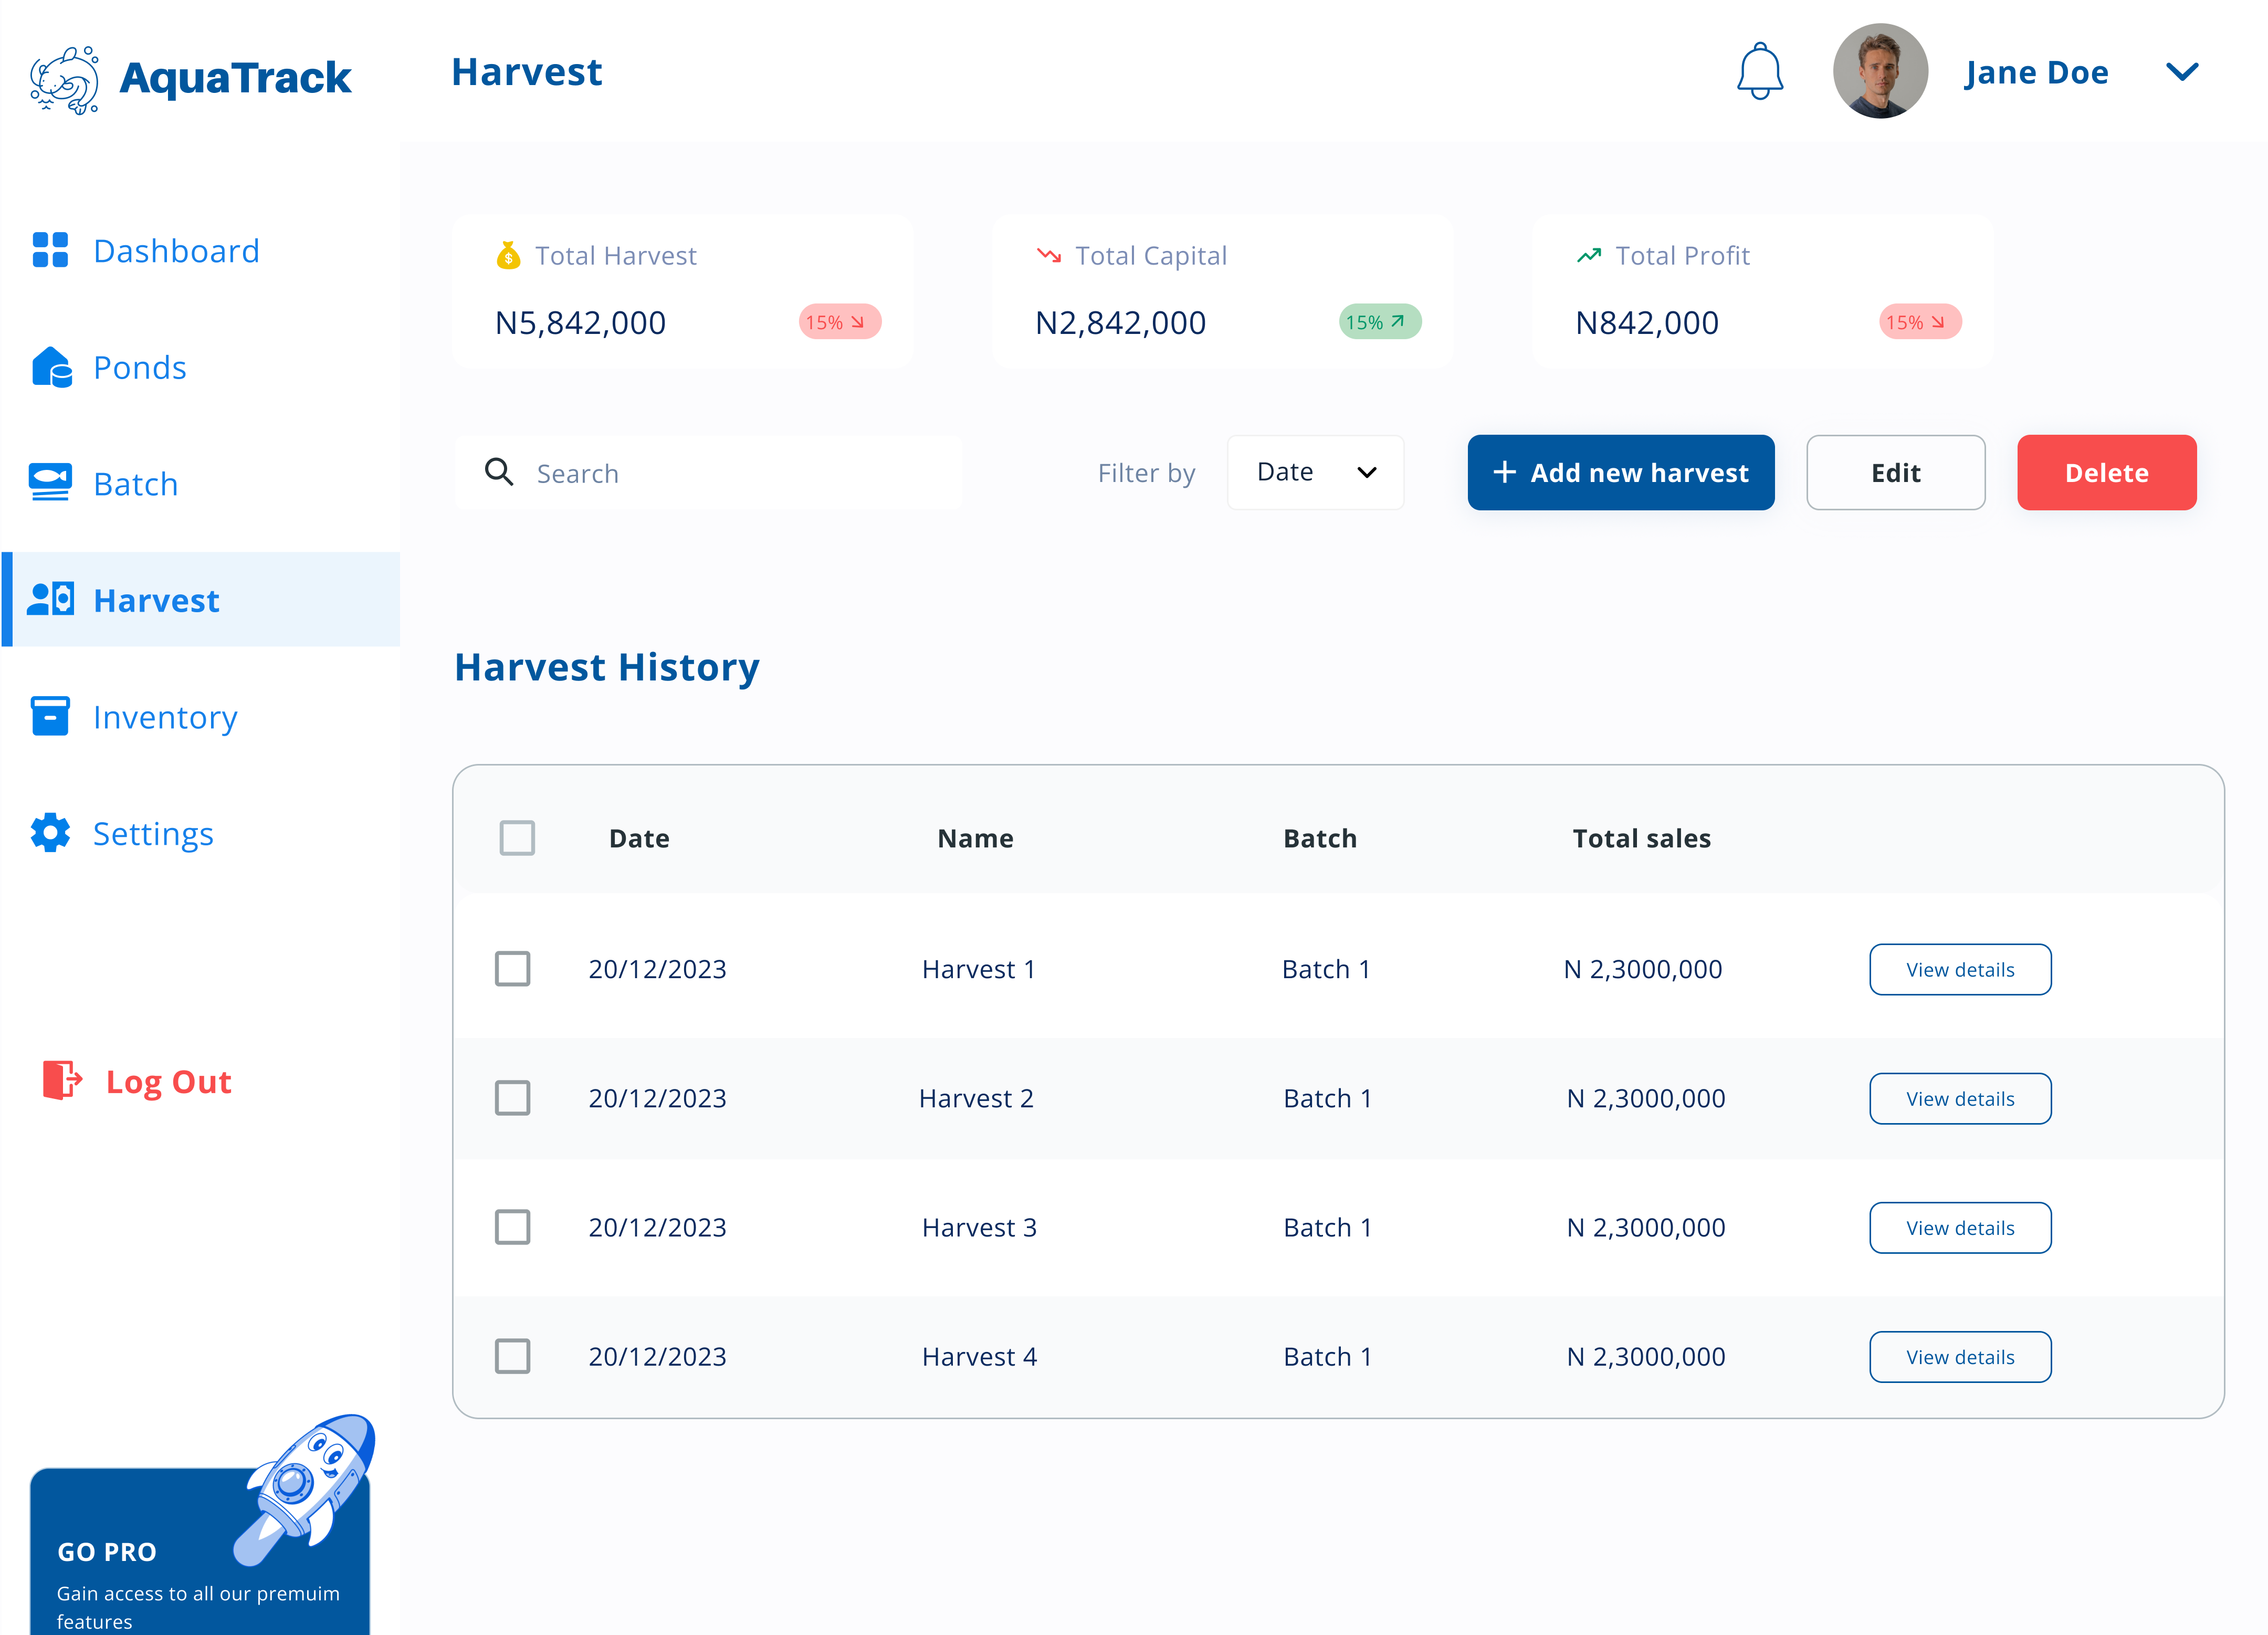
Aquatrack Harvest Default
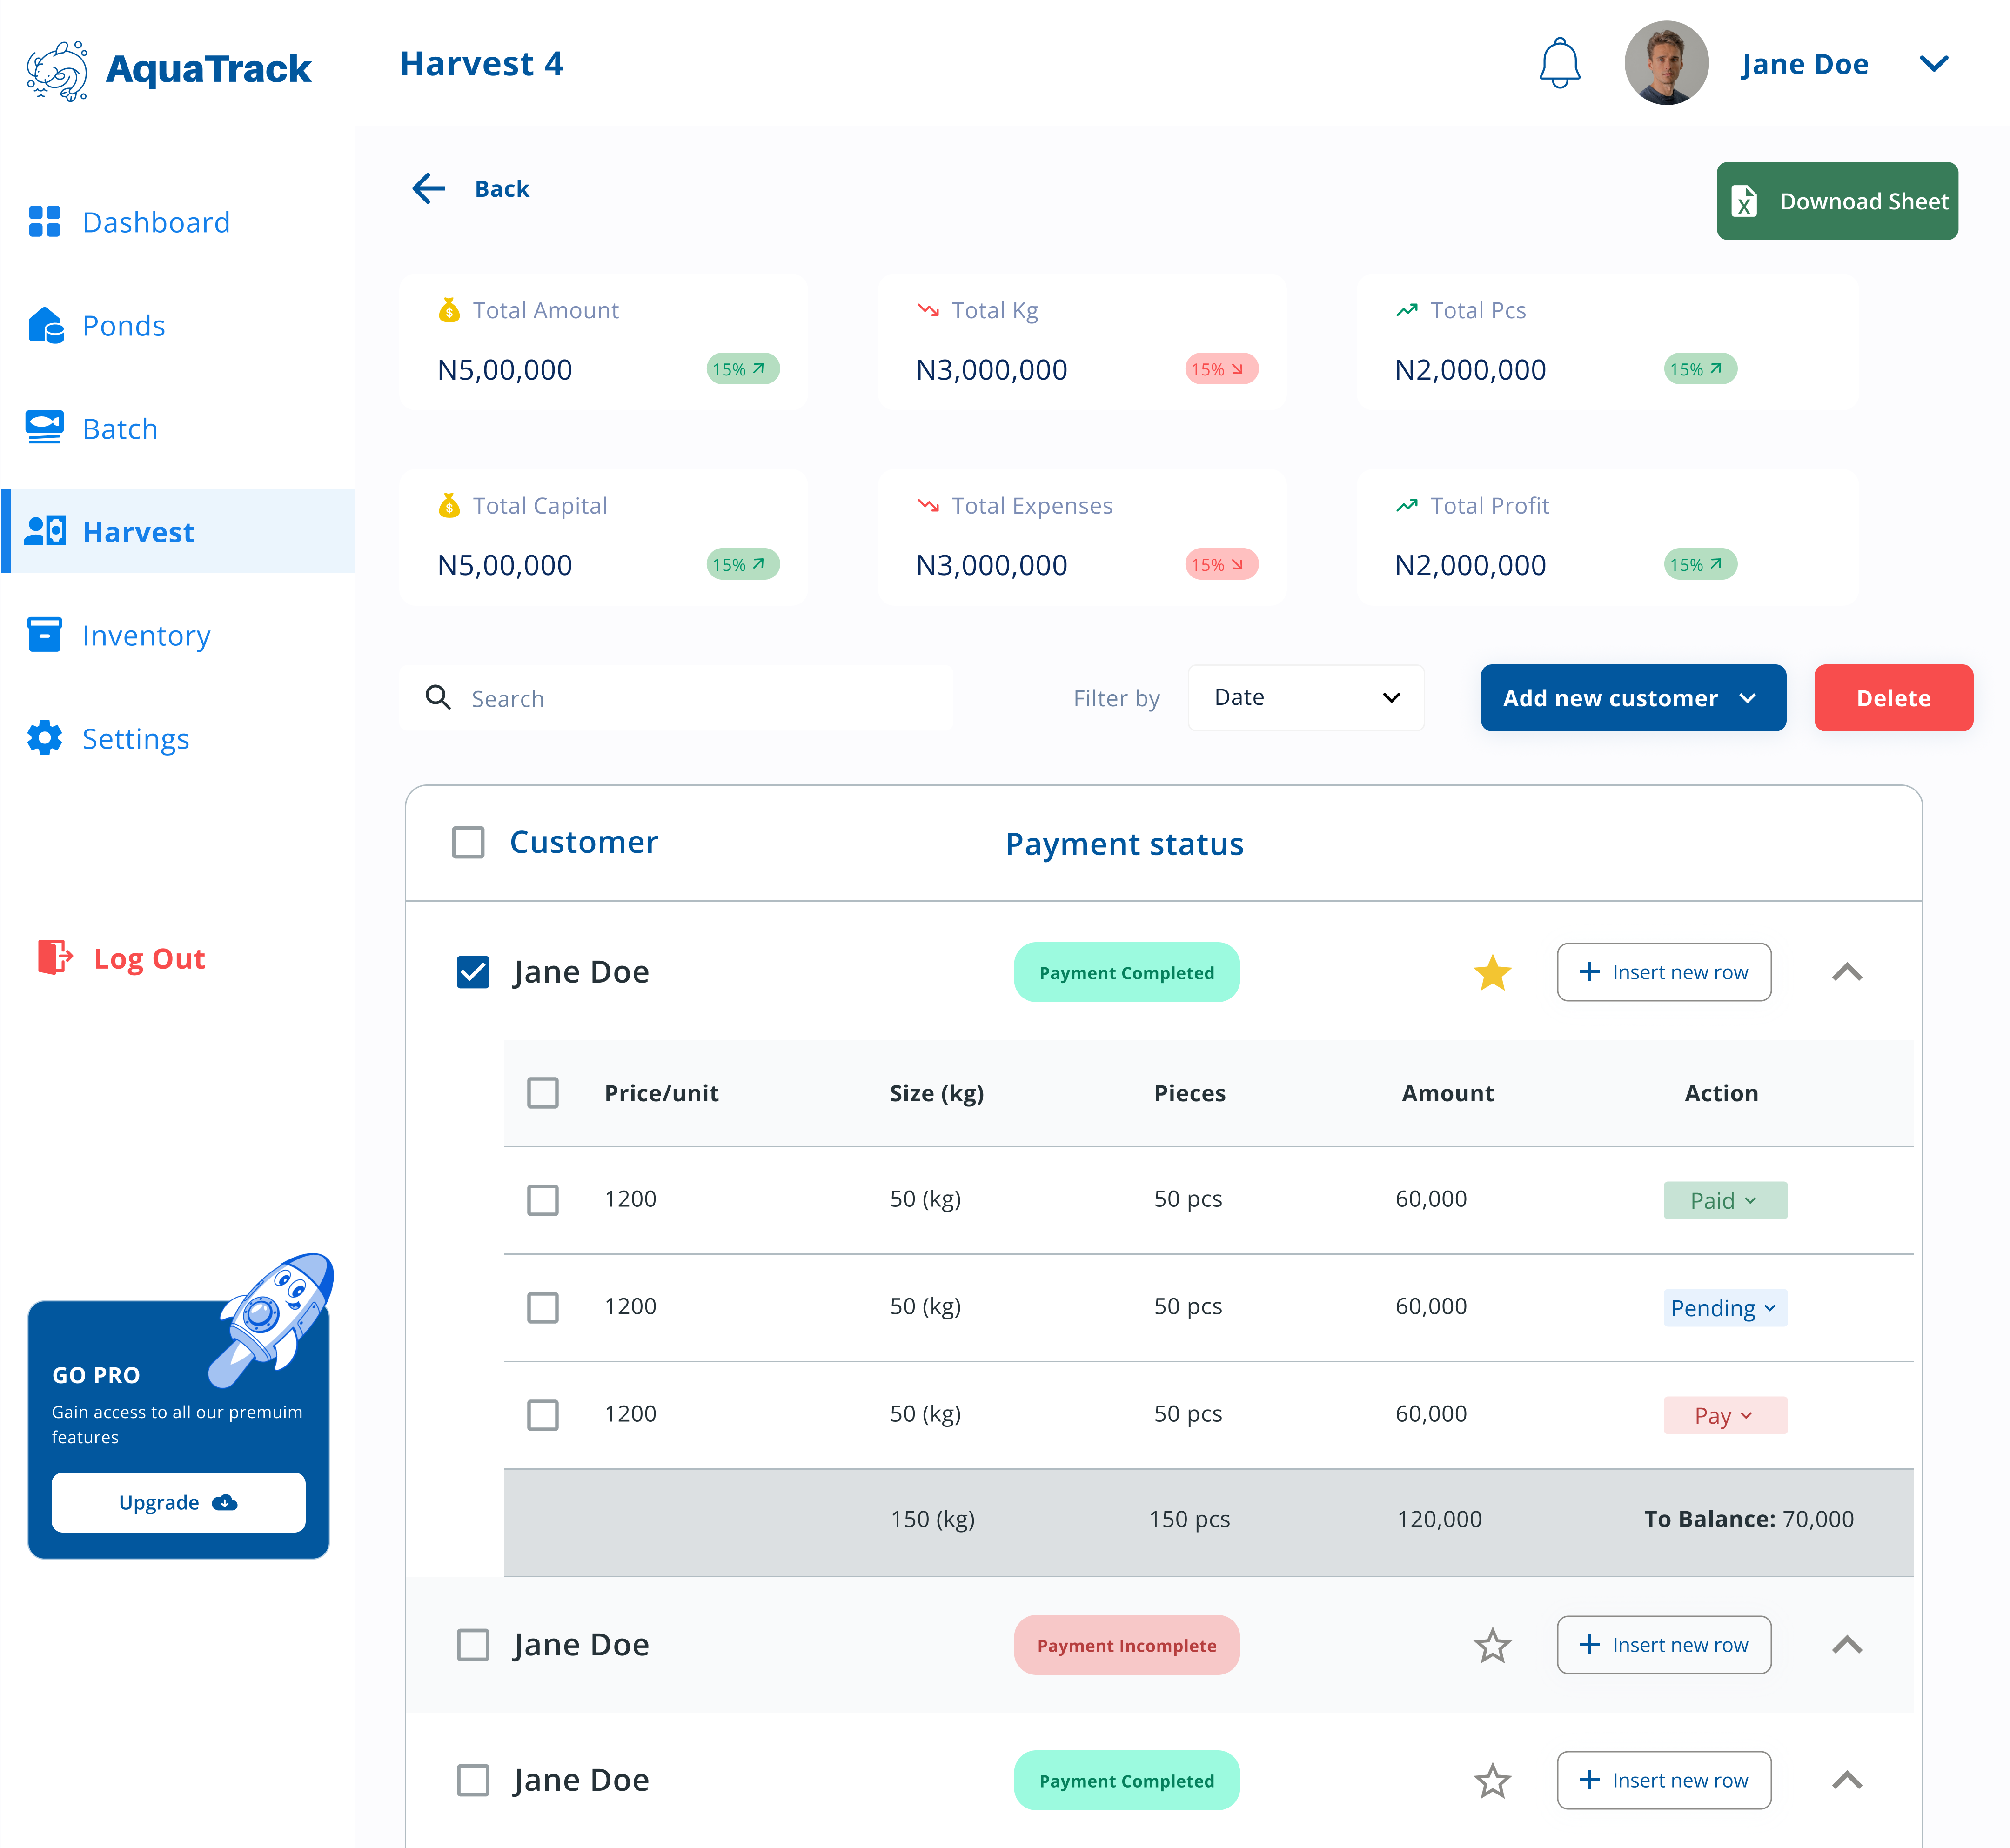
Aquatrack Harvest Active
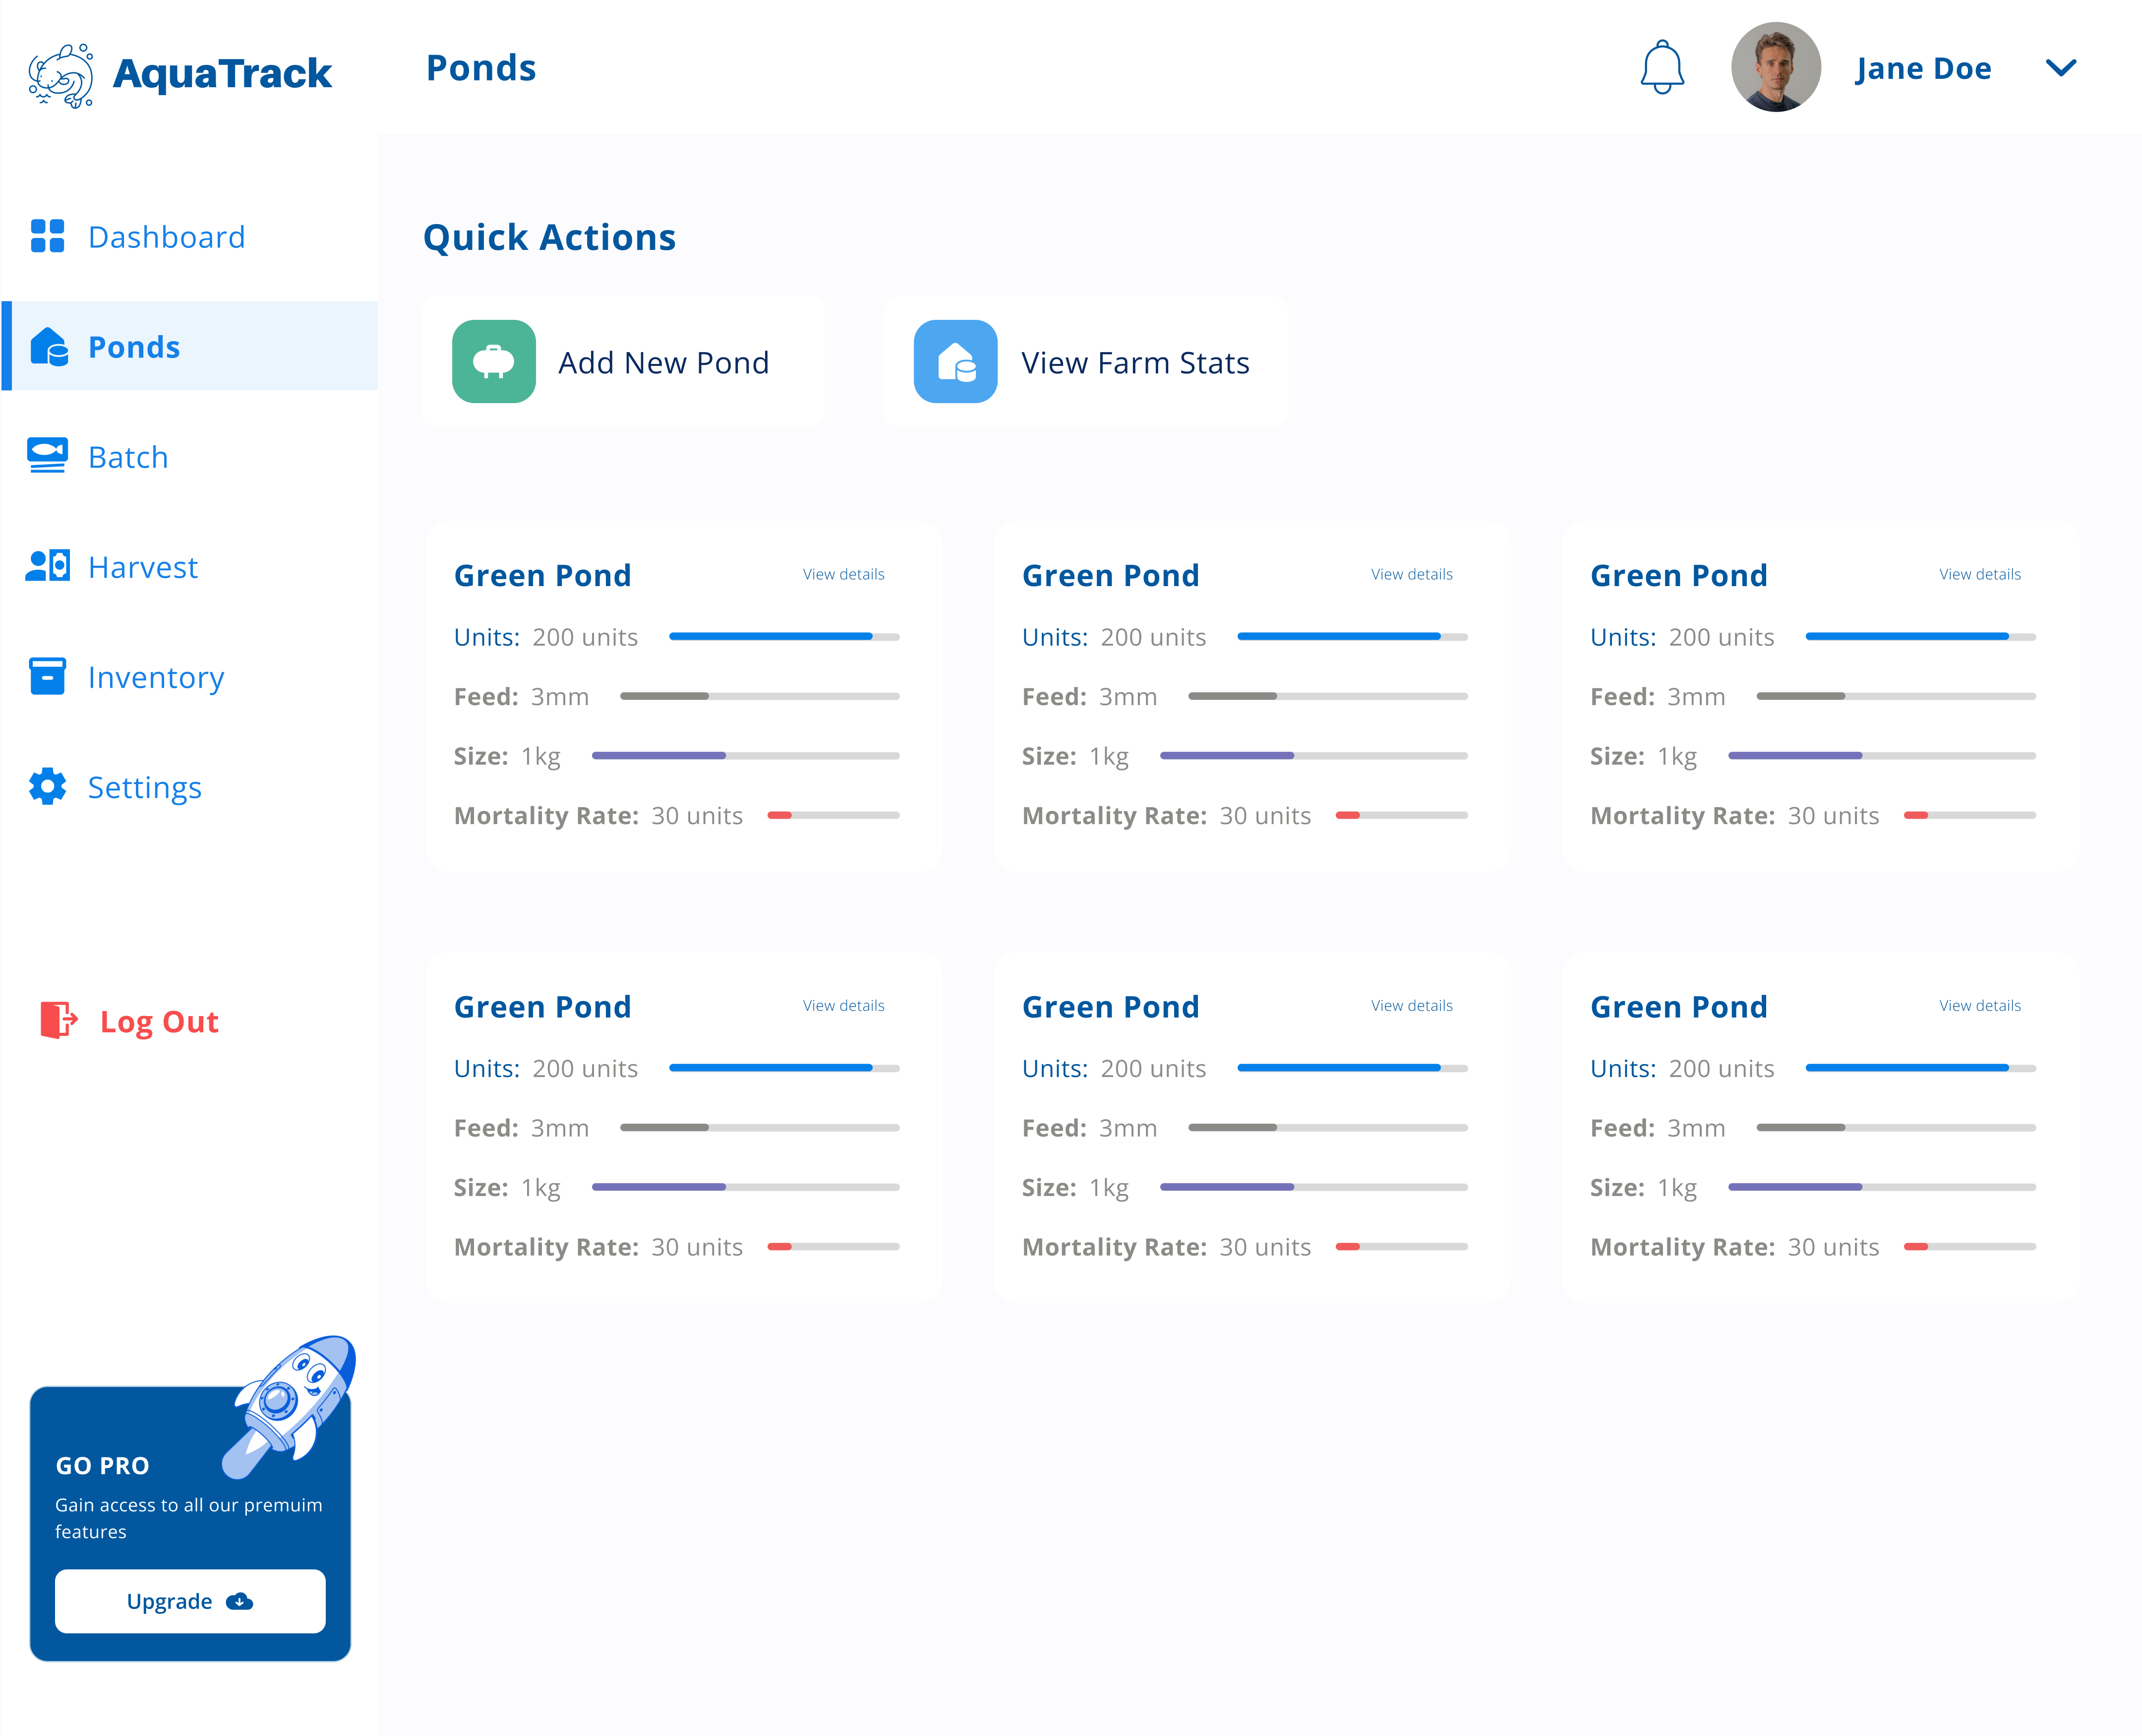
Aquatrack Ponds Active
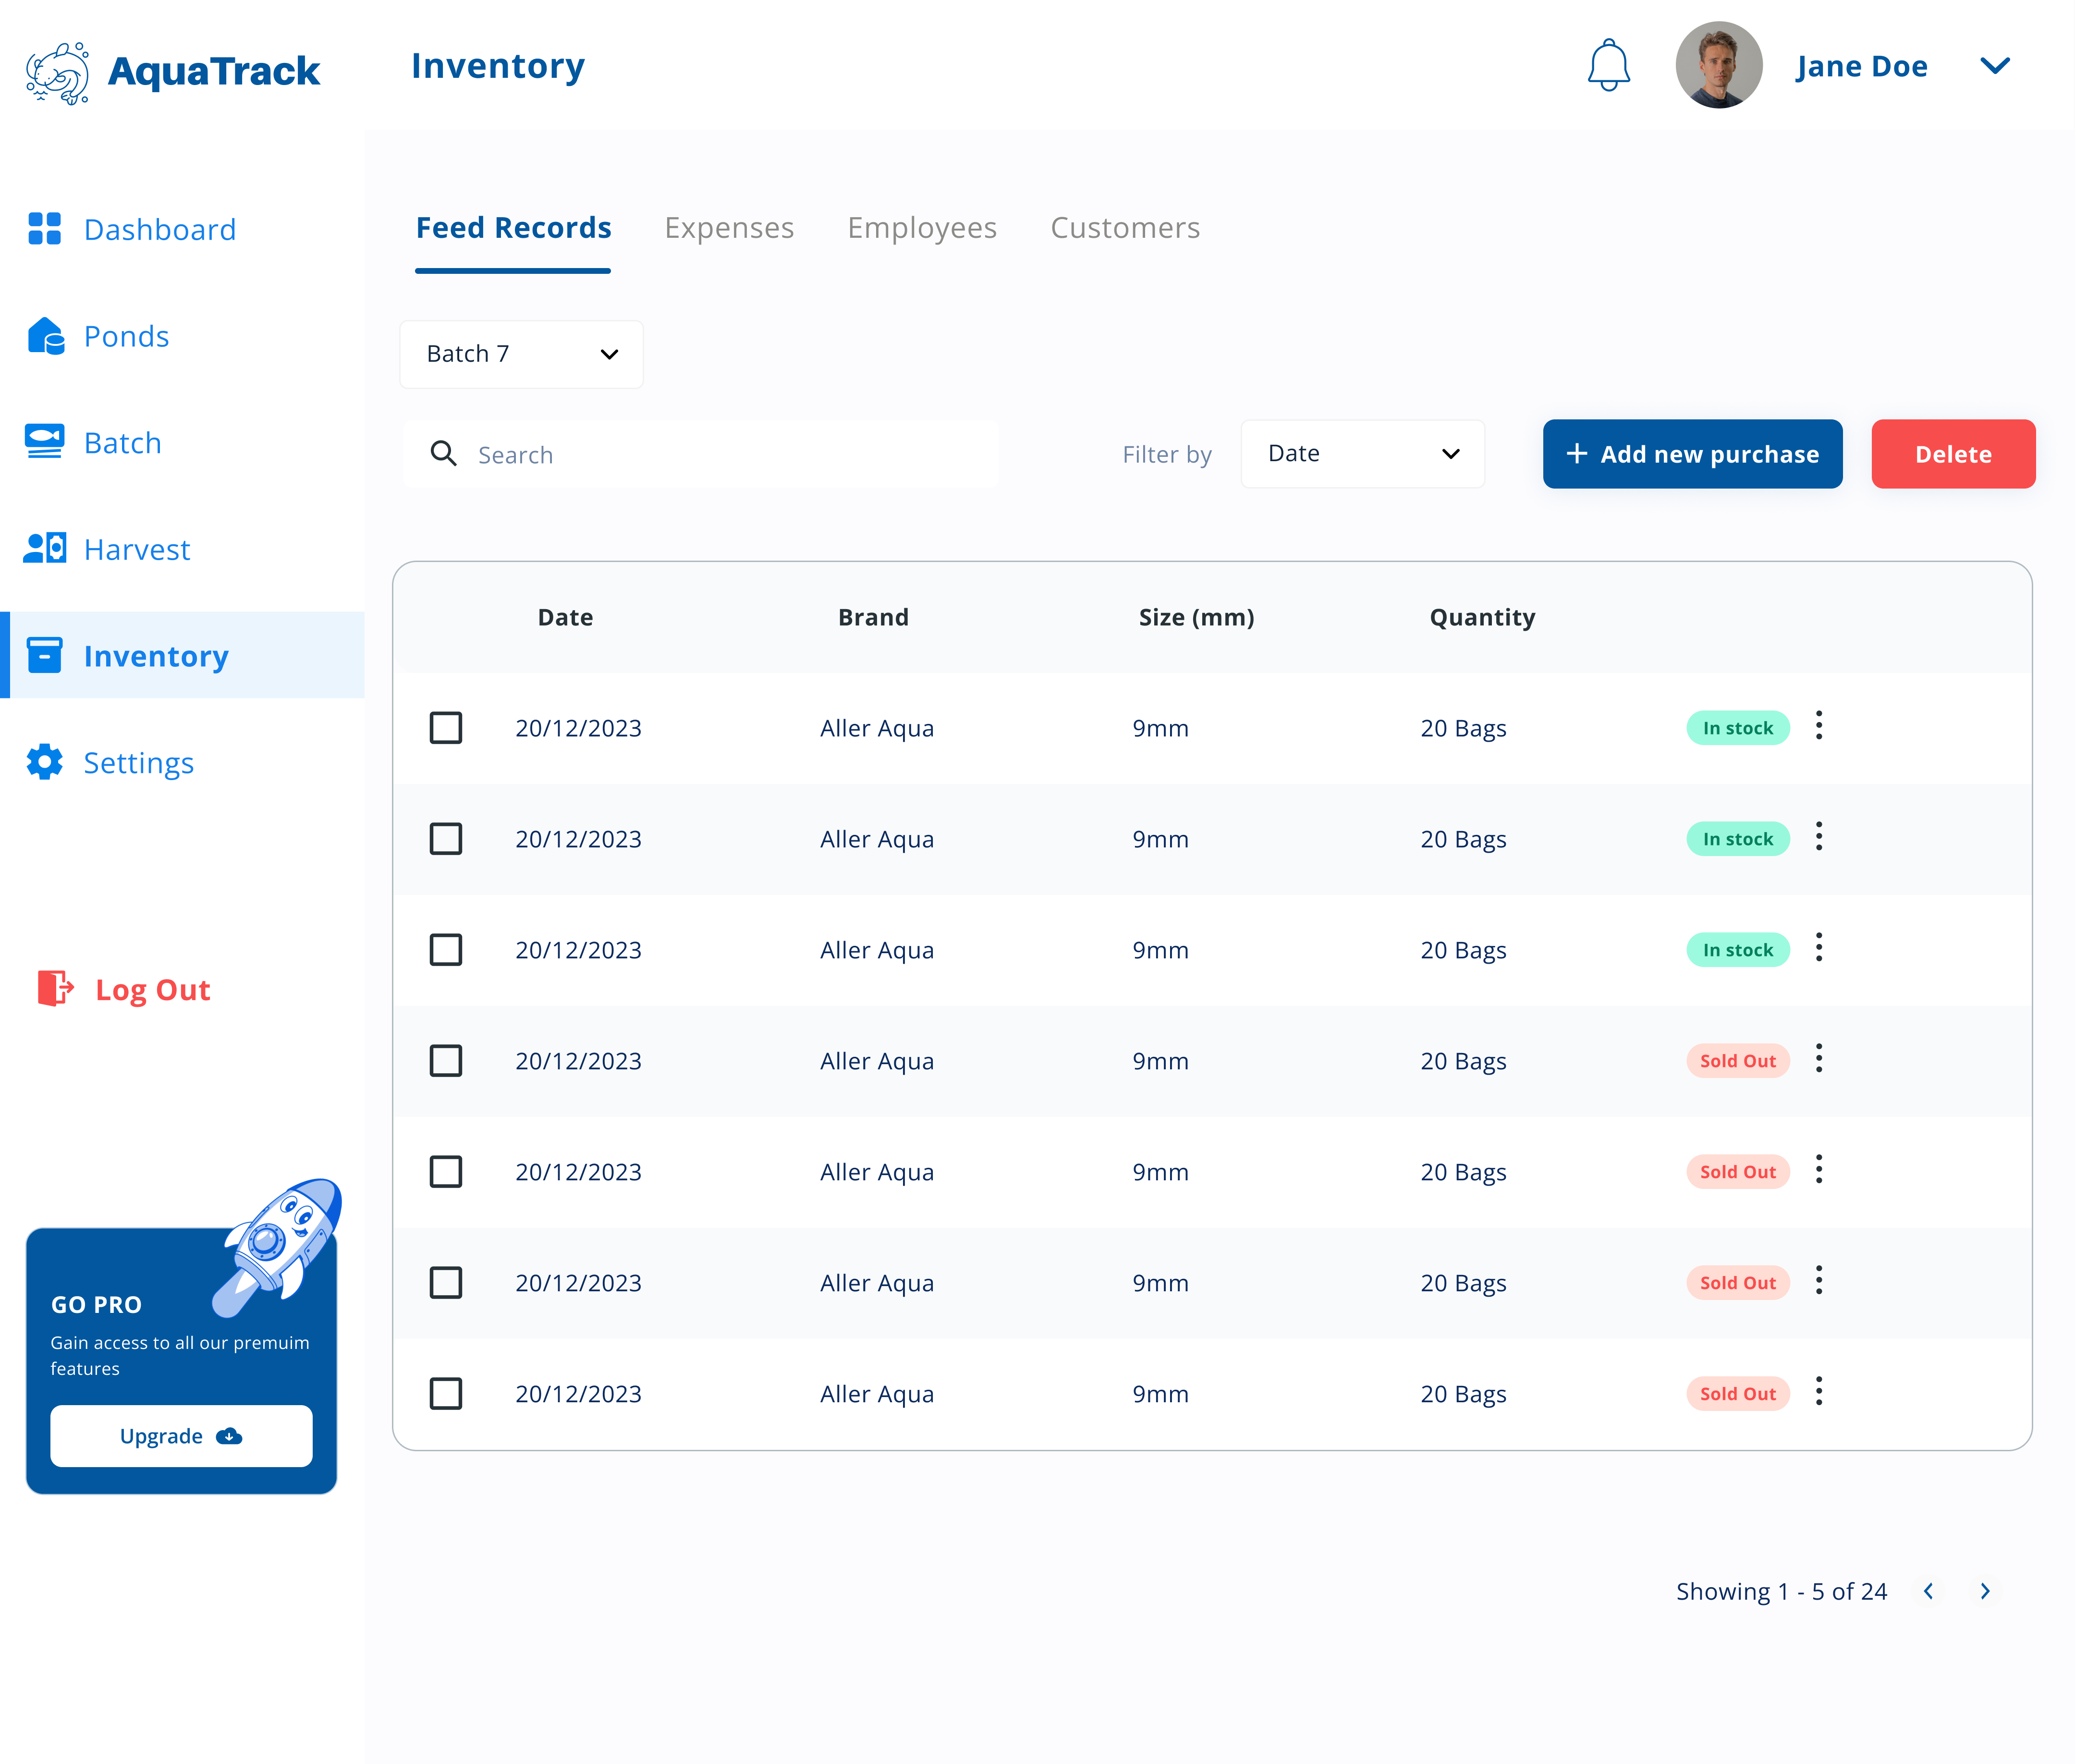
Aquatrack Inventory
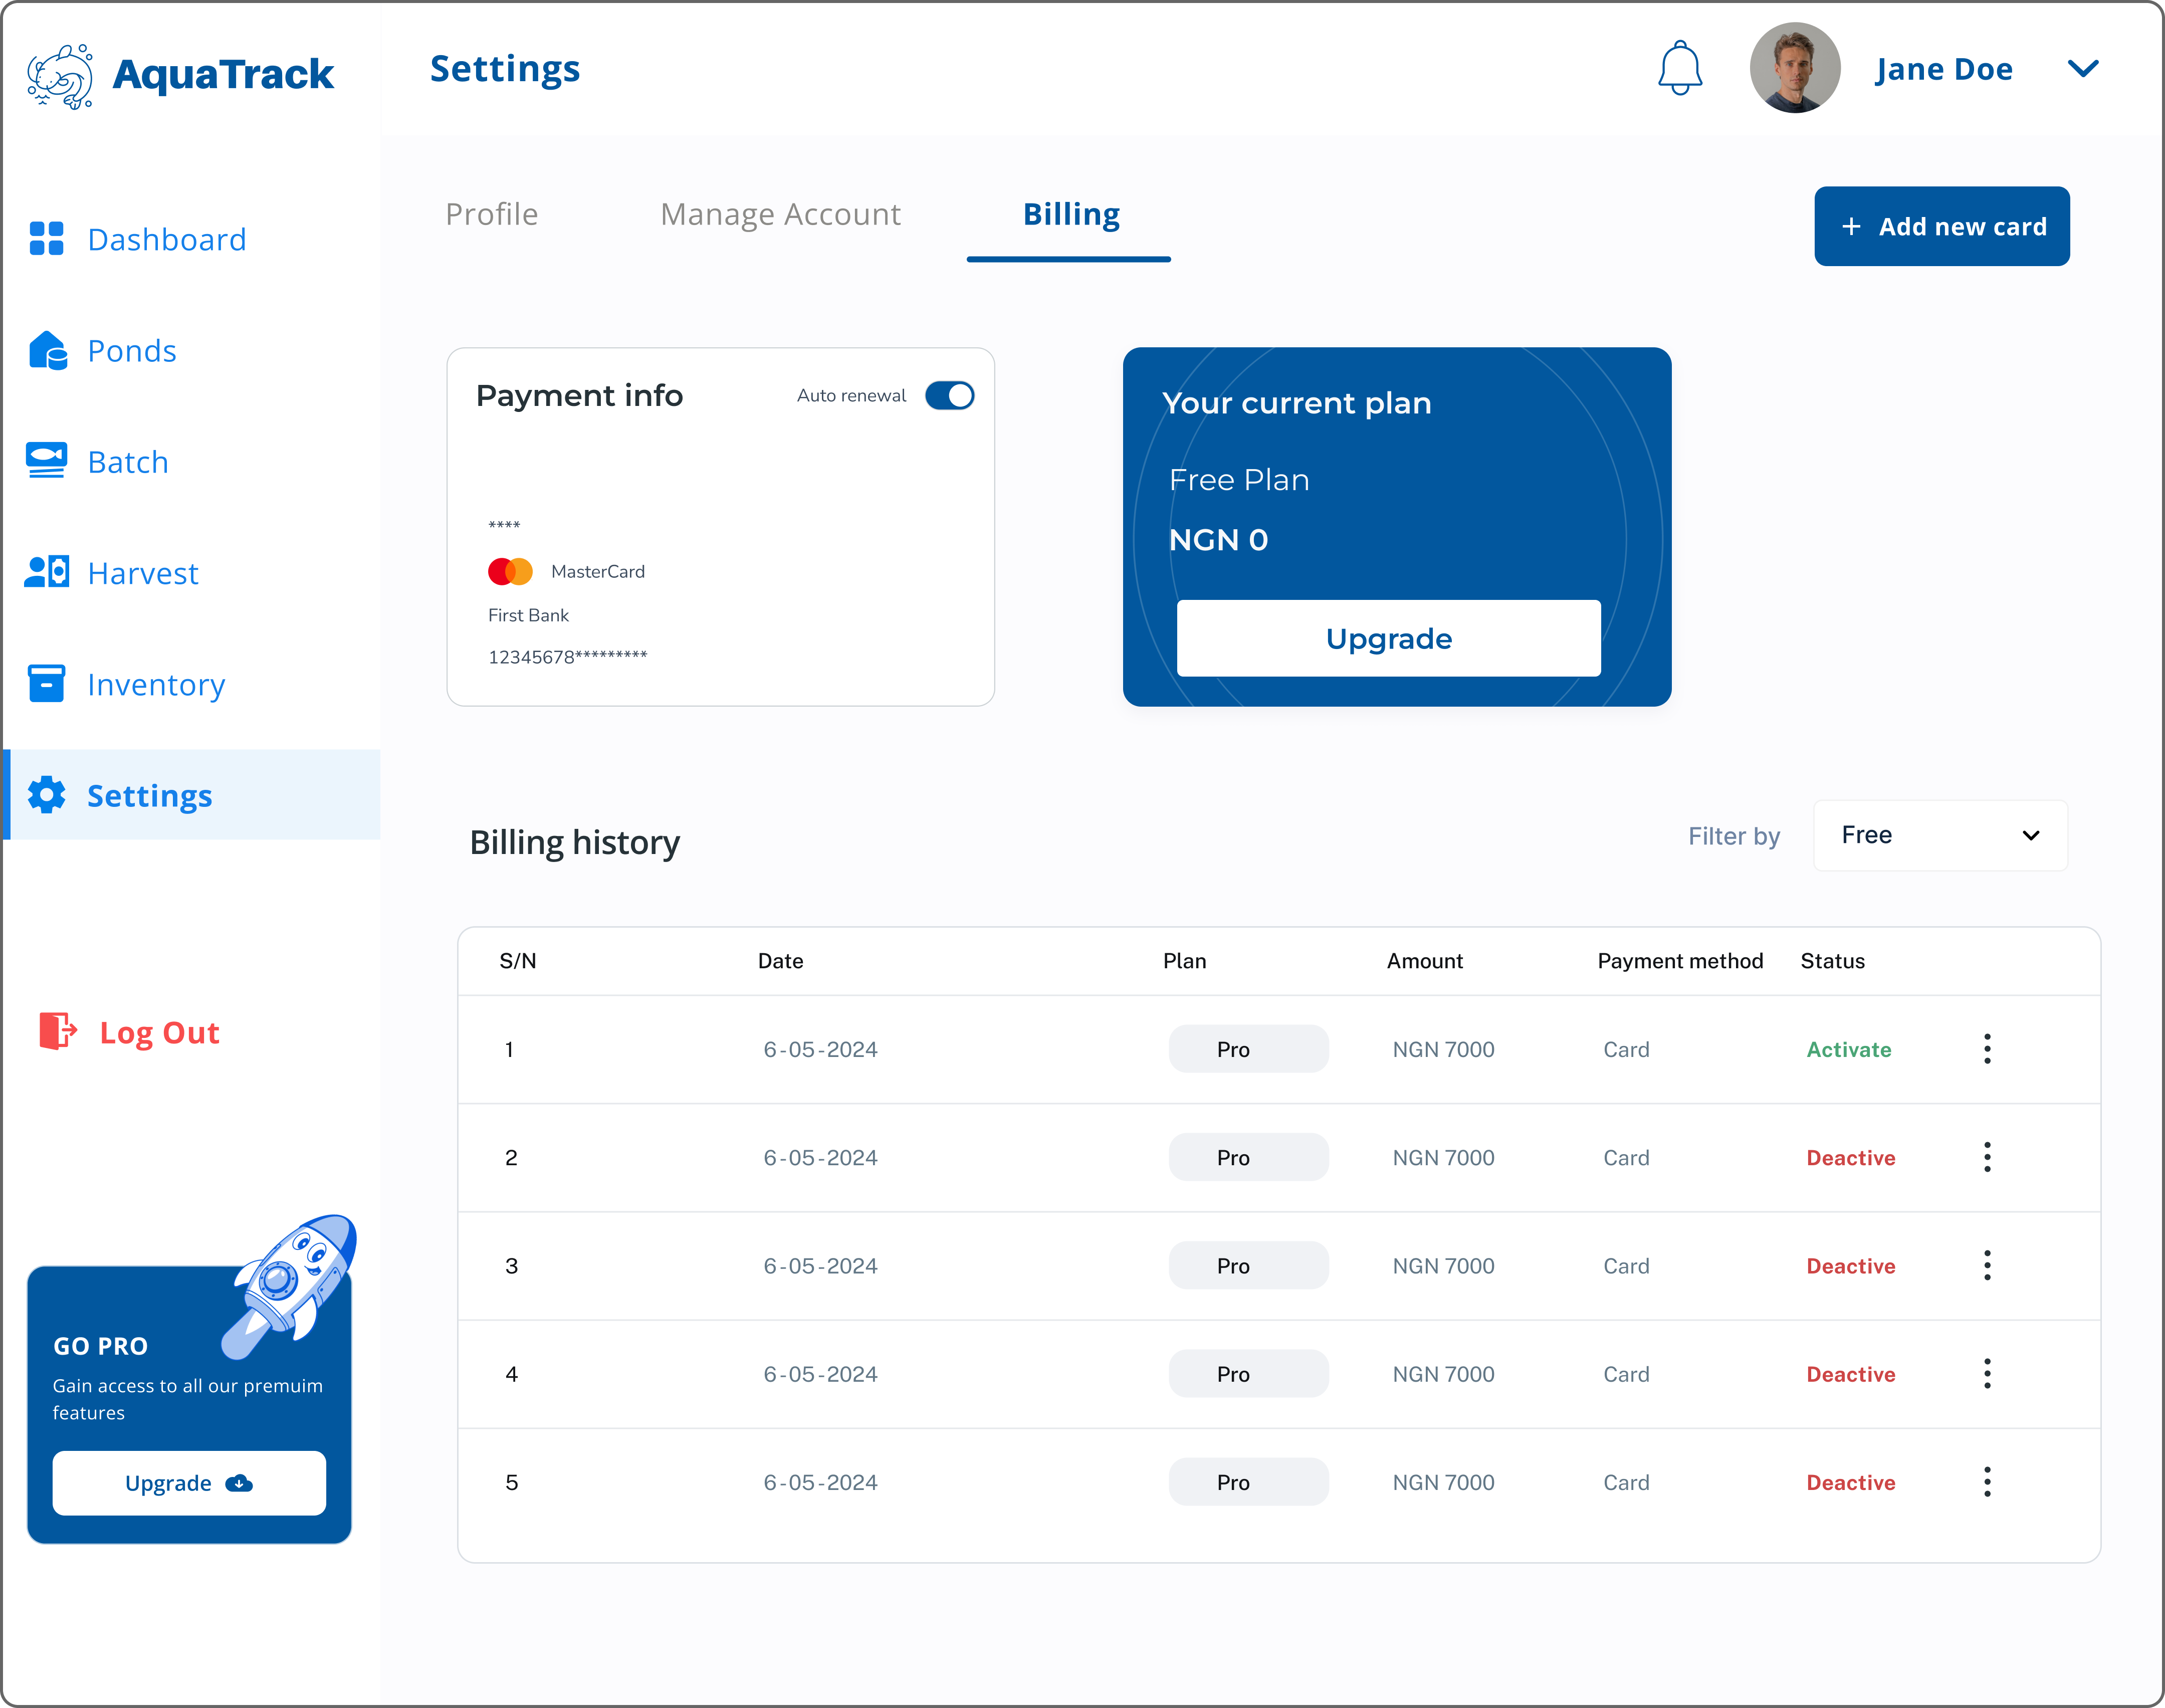
Aquatrack Settings Payment
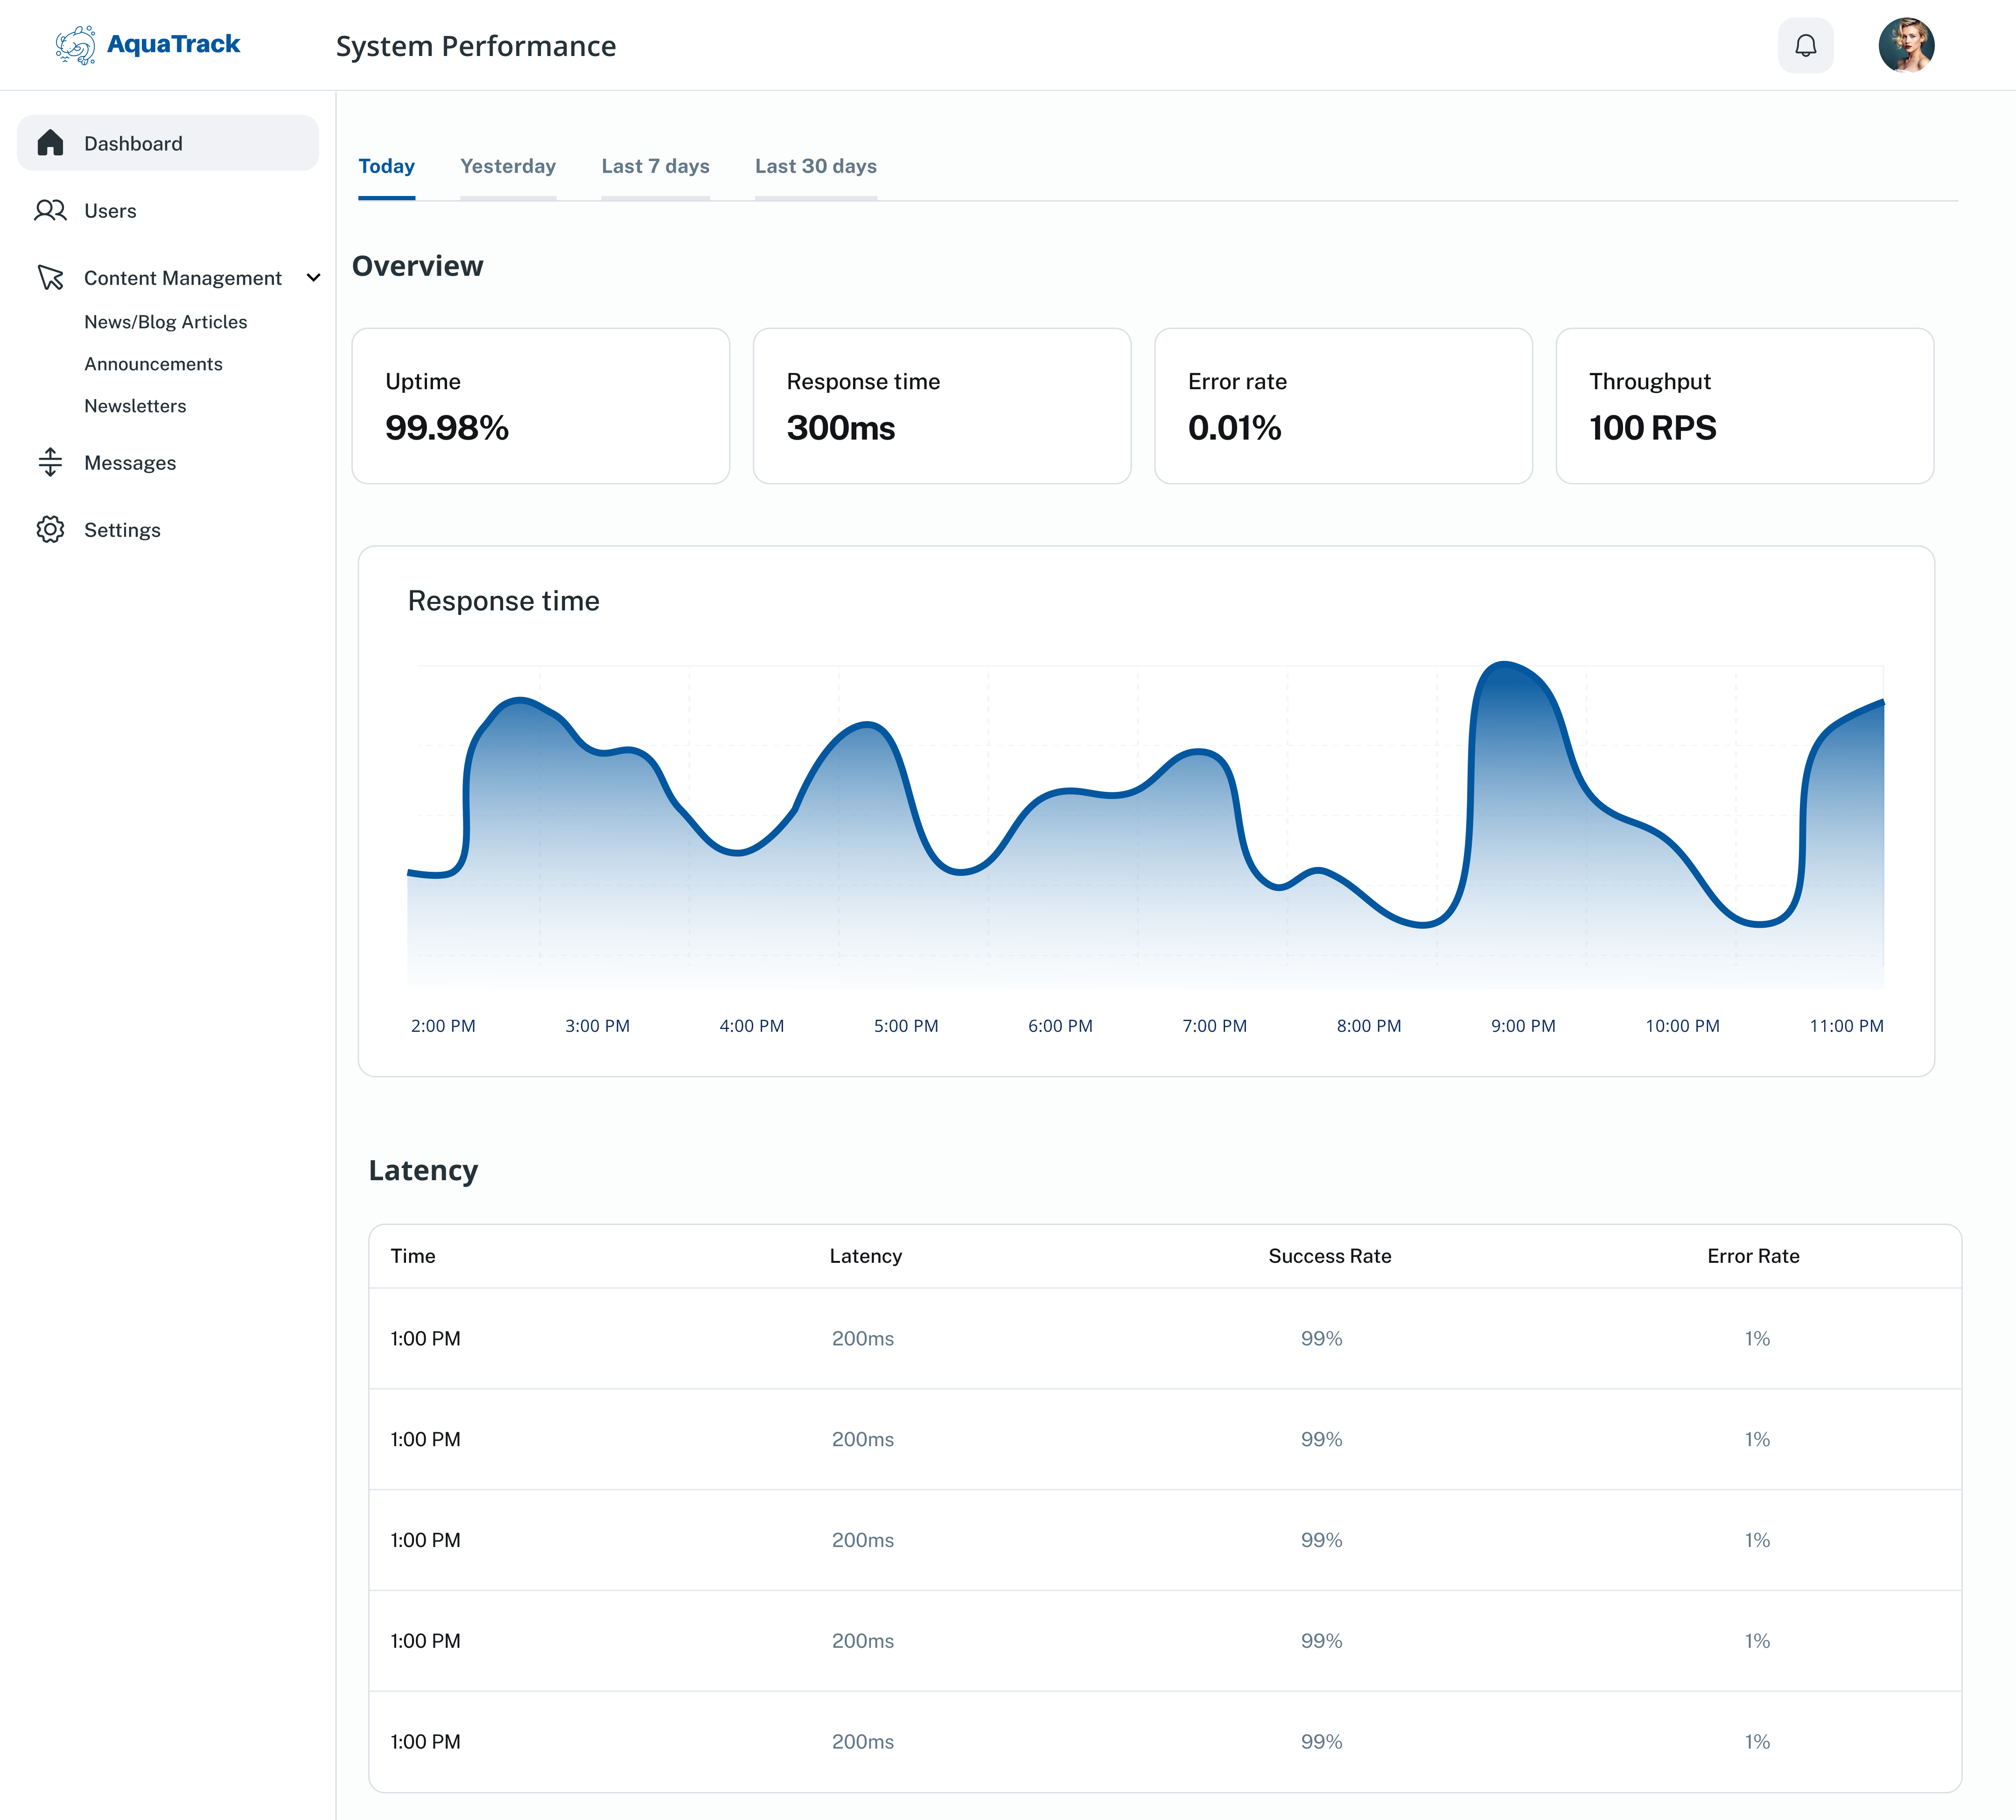
Aquatrack System Performance
Results & Impact
350+
Farmers onboarded
12%
Paid conversion
$28k
Grant raised
10+ Tons
Fish supplied
-75%
Onboarding time
-30%
Feed wastage
Final UI Preview
Watch the complete platform in action, from farmer onboarding to daily operations and financial tracking.
Key Learnings
Simplicity beats features
Every additional field in a form meant fewer farmers completing it. Ruthless feature prioritization was critical.
User testing with real farmers
Lab testing missed real-world constraints. Visiting farms revealed critical issues like poor lighting for photography and intermittent power.
No-code made iteration fast
Building with Lovable let me ship features, gather feedback, and iterate within days. Traditional development would have delayed learning.
Business model drives design
Understanding why farmers would pay shaped everything. Free tier design, premium feature positioning, and pricing all had to solve their real needs.
Interested in working together?
Let's discuss how I can help bring your next project to life with thoughtful design and strategic thinking.
Start a Conversation